Washington, D.C., often seen as a symbol of power and progress, harbors a much less visible truth: its unemployment rates are deeply divided by geography, with stark differences between neighborhoods. In this blog post, we take a closer look at how unemployment in D.C. is influenced by geography and explore what that means for the city’s communities.
The Numbers Behind the Narrative
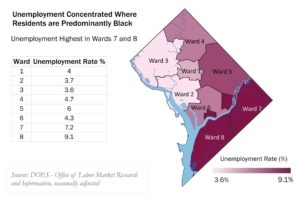
To get a clearer picture of unemployment in Washington, D.C., it’s helpful to look at the numbers. According to the U.S. Bureau of Labor Statistics (BLS), Washington, D.C.’s unemployment rate was approximately 4.5% as of December 2024. While this may seem relatively low, there are significant variations across the city. For example, neighborhoods in Ward 2 and Ward 3 – affluent areas with higher levels of education – often see unemployment rates lower than 2%. In contrast, neighborhoods east of the Anacostia River, in Ward 7 and Ward 8, report unemployment rates ranging from 7% to 10%, with some areas exceeding 12%. These stark differences highlight the need to look beyond the citywide average to fully understand the unemployment landscape.
It’s also important to note that these figures do not yet account for the potential impact of recent federal layoffs. As a significant portion of the city’s workforce is employed by the federal government, recent job cuts and hiring freezes could lead to an uptick in unemployment rates, particularly in sectors closely tied to government agencies. These layoffs could exacerbate existing challenges in job access, especially in neighborhoods already facing higher unemployment rates.
The Geography of Unemployment
 Looking closer at the geography of unemployment, there are clear divides between the west and east sides of the city. Wealthier neighborhoods on the west side – like Dupont Circle (Ward 2), Foggy Bottom (Ward 2), and Cleveland Park (Ward 3) – are home to thriving businesses, prestigious universities, and political institutions. These areas also boast higher rates of education, with more residents holding bachelor’s degrees or advanced certifications. Unsurprisingly, unemployment rates in these neighborhoods are consistently lower than the citywide average, and residents have greater access to job opportunities and resources.
In contrast, neighborhoods east of the Anacostia River suffer from poor public transportation options, lower educational attainment, and limited access to jobs. Neighborhoods like Deanwood (Ward 7) and Congress Heights (Ward 8) continue to experience economic challenges, with many residents struggling to find stable employment. Also, while revitalization efforts in areas like Shaw and the H Street Corridor (Ward 6) have transformed these neighborhoods into bustling commercial hubs, many longtime residents have been displaced and lack access to the new economic opportunities being created. D.C.’s unemployment rate is not uniform across the city, and its residents face varying challenges based on where they live.
D.C.’s Response to Unemployment Challenges
While the unemployment picture in D.C. remains complex, the Mayor’s Office has implemented a range of initiatives to address these challenges and support workers across the city. One of the key programs is the DC Infrastructure Academy, which provides job training in fields such as construction, technology, and public works, preparing residents, especially those in historically underserved neighborhoods, for in-demand positions in D.C.’s growing economy.
Additionally, the Office of the Deputy Mayor for Planning and Economic Development (DMPED) has launched several workforce development initiatives aimed at creating job opportunities for residents in high-unemployment areas. DMPED is working closely with employers in key sectors to connect them with job seekers from Ward 7, Ward 8, and other parts of the city where unemployment remains higher.
The Mayor has also focused on providing support for small businesses and entrepreneurs. Programs like Main Streets have revitalized local businesses, helping entrepreneurs access the resources they need to thrive. These efforts aim to create sustainable economic growth and employment opportunities in areas that need them most.
*****
D.C.’s unemployment landscape remains highly varied. As D.C. faces ongoing shifts, including the uncertainty of federal job cuts, we may see growing gaps in employment outcomes. If the job market becomes more strained, residents in already under-resourced areas could face even greater challenges in accessing stable, well-paying jobs.
Sources:
- U.S. Bureau of Labor Statistics, “Local Area Unemployment Statistics,” 2024.
- D.C. Department of Employment Services, “Annual Employment Report,” 2023.
- DC Fiscal Policy Institute, “The State of Economic Inequality in Washington, D.C.,” 2023.
- The Washington Post, “How Gentrification Has Changed D.C.,” 2022.
Header image by Billion Images on Canva


