When we have all data online it will be great for humanity. It is a prerequisite to solving many problems that humankind faces.
– Robert Cailliau (computer scientist who helped develop the World Wide Web)
We could not agree with Robert Cailliau more. We have worked for more than a decade to make data about our DC community easily accessible and understandable. Today we want to share with you one great data resource: DCHealthMatters.org. This online portal provides a one-stop resource for data tailored to DC. The site places an emphasis on community health indicators and related resources that impact the health of DC communities. You will find up-to-date demographic, health and social determinants data; hundreds of maps, tables and figures; and, promising practices.
The idea for DCHealthMatters.org dates back 10-15 years when a group of us were lamenting why it was so difficult to access reliable and timely data about our DC community. Sure, one could go to the detailed Census data files, or any number of publicly-available databases, but they were not easy to navigate for people who didn’t have a strong data management and analytics background. We wanted to developed a centralized place where anyone – regardless of their data skills – could access this information. But, we needed funding. In 2012, we finally secured those funds when Children’s National Hospital was awarded a NIH supplemental grant that funded the deployment of this portal for our DC community. As part of the grant, we worked with local community stakeholders to design a tool that provides meaningful local data to anyone interested in accessing it. Once the NIH grant funding ended, the portal was adopted by the DC Health Matters Collaborative (DCHMC). The DCHMC is a unique collaboration among non-profit hospitals and community health centers serving the District. The DCHMC continues to fund the maintenance of this resource.
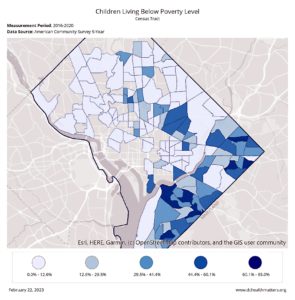
 DCHealthMatters.org is a source of thousands of different indicators – ranging from population numbers to clinical conditions to social contexts – many of which are available by location (ZIP Code, Ward, census tract, etc.), age, race and sex. The data are often able to be explored visually on graphs and charts. For example, here is information on a commonly searched indicator: Children Living in Poverty. Within a couple of clicks, we learn that an estimated 23% of DC’s children live in poverty. A natural question may be: where in DC are child poverty levels the greatest? We can answer that question visually by looking at the maps generated on the site.
We’ve displayed the Census Tract map here – it’s clear that poverty is concentrated in tracts that are in SE/NE part of DC. There are so many ways you can view the poverty data on the site – different charts, graphs, geographies, demographics, etc. We’ve only touched on a few in this post.
The most frequently accessed information on the site is the demographics data – you can find the most recent estimates of population statistics on DCHealthMatters.org including data on overall population numbers as well as information by race, ethnicity, age, sex, income, housing, education, and employment.
DCHealthMatters.org is quite heavily used (more than 45K hits annually!), but sometimes referred to as a well-kept data secret. This secret is not worth keeping – let your peers, friends, and colleagues know about this resource. It’s free and easy to use. Once you spend some time on the site, you’ll see that it contains much more than just numbers – it’s also home to a collection of promising practices, reports, a blog, and more. Have fun getting lost in all the data (and more)!
About the author

Chaya Merrill, DrPH
Director of Child Health Data Labwithin the Child Health Advocacy Institute at Children's National Hospital


